
Dec. 8, 2014
A Nov. 19 report to the school board on testing results from last school year was touted as indicating promise. Performance was up. Gaps had narrowed.
CMS Assessment Results and School Performance Framework Overview, Nov. 19, 2014, p. 6.
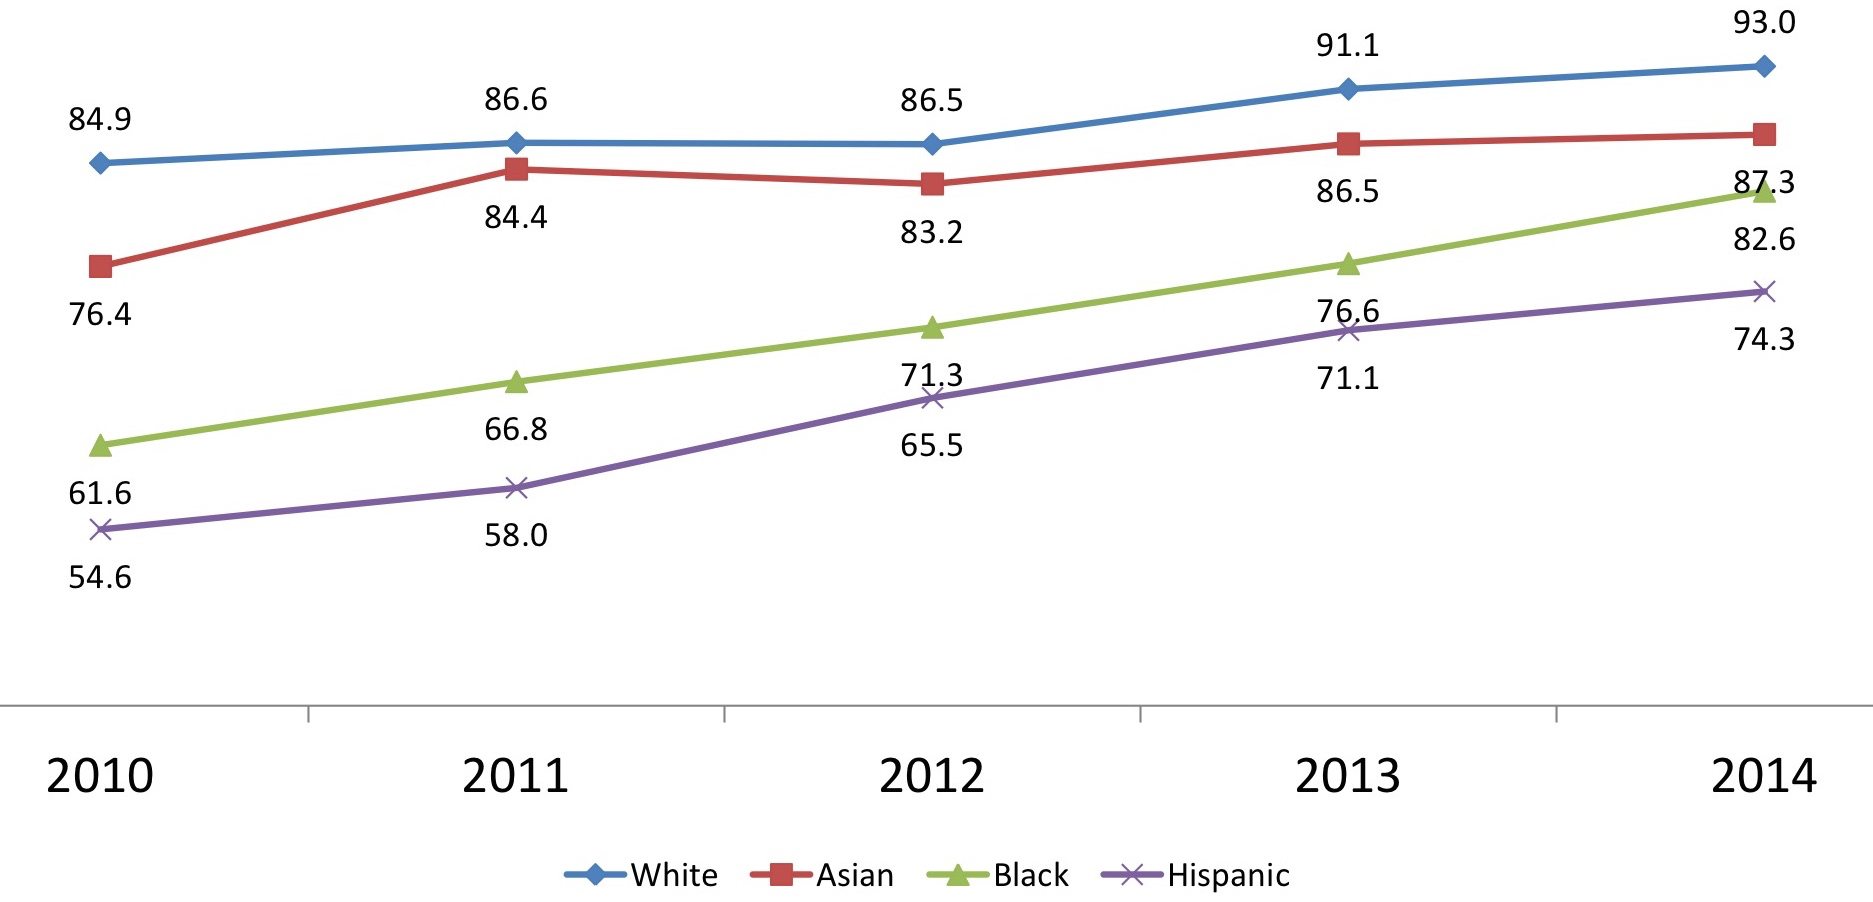
Near the top of the PowerPoint stack was the chart above, showing graduation rates by four groups of students, from 2010 through 2014. The black-white gap of 23.3 points had narrowed to 10.4 points. The Hispanic-white gap of 30.3 points had narrowed to 18.7 points.
Yay!
CMS Assessment Results and School Performance Framework Overview, Nov. 19, 2014, p. 20.
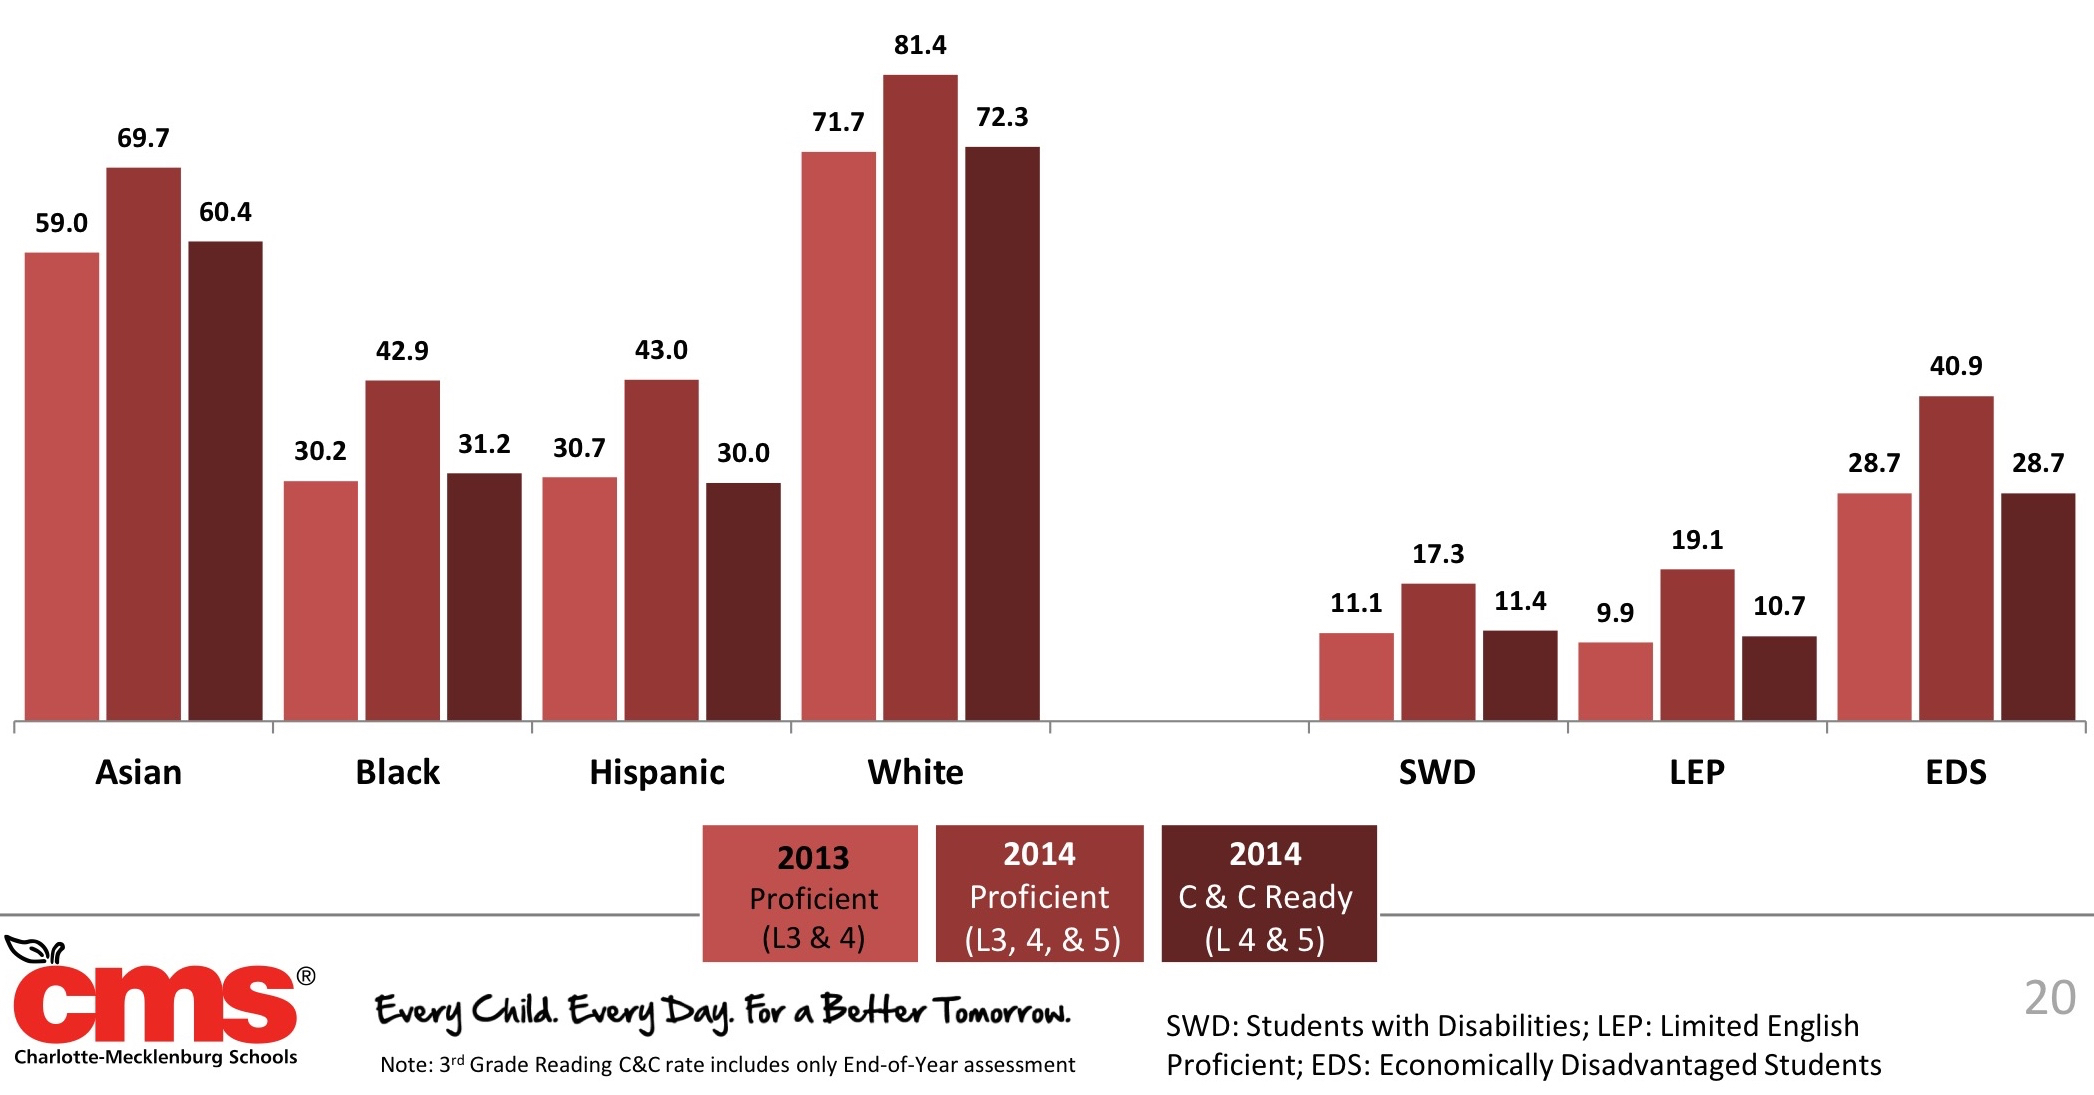
A bit deeper in the report is this chart, above. The chart combines reading results for grades 3-8 for seven subgroups of students. Within each subgroup, there are three bars: a 2013 base year for students testing proficient (levels 3 and 4); the comparable 2014 result; and the 2014 results for “college and career ready,” levels 4 and 5.
Here, results are more sobering. In the foundational skill of reading in 2014, the black-white proficiency gap was 38.5 points, down from 41.5 points in 2013. The Hispanic-white gap was 39.4 points, down from 41 points in 2013.
Closing gaps are worth applauding. But 38- and 39-point gaps between groups of students? The gap between children in poverty and children not in poverty may be even higher: The reported 2014 proficient rate among economically disadvantaged students at 40.9. CMS used to include a rate for children not economically disadvantaged; it was usually in the 90s.
It’s hard to know that public education is making any substantive progress in educating students. Clearly most of the issues are nearly intractable, as the upcoming task force talking about how to pull families out of poverty will find.
One thing’s sure: Unless there is far more attention paid to the substance of what school board members listened to Nov. 19, there will be no public consensus on how to move forward.